
What Does a Qualified ABA Lead Cost in 2026?
Published benchmarks put behavioral-health leads among the most expensive in healthcare - and rising faster than any other specialty. Here is what the data actually says, why the same click costs different money in different states, and the arithmetic that decides whether your lead cost is a problem at all.


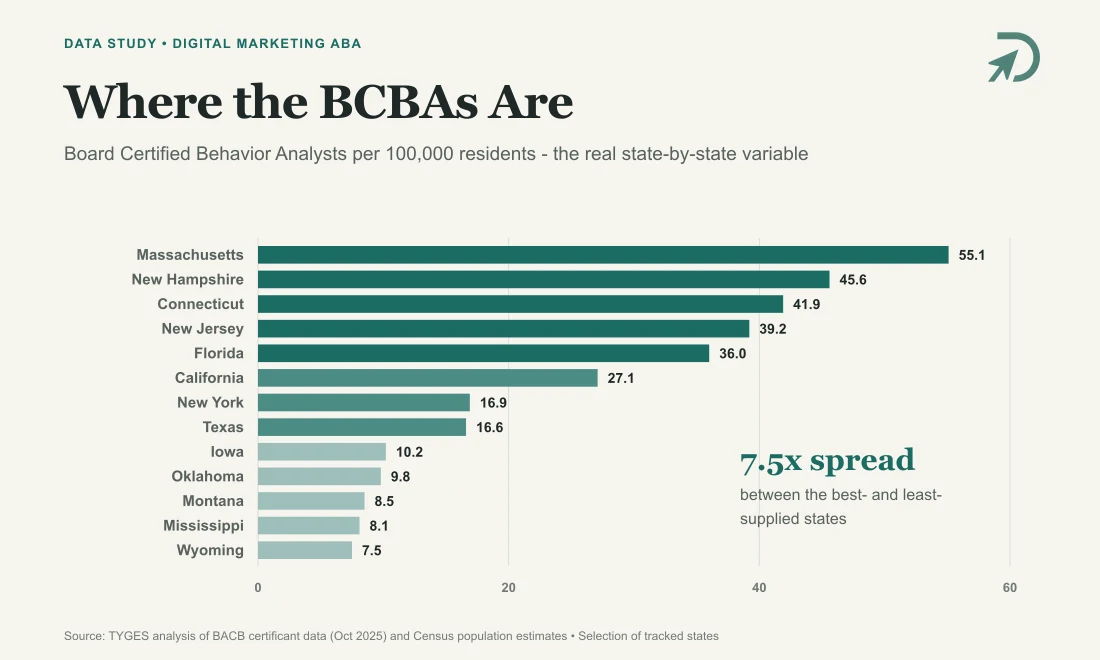
Provider supply is the real state-by-state variable: a 7.5x spread in BCBA density between Massachusetts and Wyoming.
- $141.17
- Median cost per lead, mental-health search ads (LocaliQ, 2026)
- +146%
- Mental-health cost per lead, year over year - the steepest rise of 16 specialties tracked
First, what counts as "qualified"
A click is not a lead, and a lead is not a client. In ABA, a qualified lead is a family or referral source that fits the practice: right geography, right age range, an insurance plan you accept, and a real intent to pursue an evaluation. Most of the numbers in circulation measure something cheaper - clicks, form fills, phone calls of any kind - which is exactly why lead costs get argued about. Throughout this piece we say precisely which definition each number uses.
What the published data says
The most recent like-for-like benchmark comes from LocaliQ's analysis of 3,542 US healthcare search campaigns: mental-health campaigns average $4.22 per click and $141.17 per lead, with a 1.85% conversion rate. That cost per lead rose 146% year over year - the steepest increase of all sixteen healthcare specialties tracked. Across all industries, WordStream's 2026 benchmark puts the average at $5.42 per click and $66.69 per lead. A mental-health lead now costs more than double the average lead.
Two caveats worth being honest about. First, there is no ABA-specific published benchmark - mental health is the closest proxy, and ABA sits inside it. Second, these "leads" are conversions (calls and form fills), not qualified leads. Benchmarks that track a stricter definition run higher: First Page Sage, which counts only a direct email, phone, or in-person connection, puts healthcare at $401 per paid-search lead, $320 per organic lead, and $361 blended. The adjacent behavioral vertical it tracks, addiction treatment, runs $297 blended.
For ABA keywords specifically, specialist agencies report clicks at $8 to $25 in mid-sized markets and $30 to $50 or more in saturated metros like Phoenix, Los Angeles, Dallas, and greater New York - agency-reported ranges, not audited data, but consistent across independent sources. On Meta, WordStream's healthcare category averages $47.47 per lead for lead campaigns, which is why paid social usually plays the awareness role in ABA rather than the direct-response role.
Why your state changes the math
Here is the finding that surprised us while researching this piece: no public state-by-state cost-per-lead data exists for ABA or for healthcare broadly. Anyone quoting "the CPL in Texas" is quoting their own account data. What does exist - and what actually drives the variation - are three measurable forces.
Demand varies by region. The CDC's latest surveillance puts autism prevalence at 1 in 31 eight-year-olds nationally, but its sites range from 9.7 per 1,000 in Laredo, Texas to 53.1 per 1,000 in the San Diego area - a five-fold spread (site-level data from counties and metros, not whole states). More identified children means more families searching.
Supply varies more. Provider density is the sharpest state-level signal we have - Board Certified Behavior Analysts per 100,000 residents (TYGES analysis of BACB certificant data, October 2025):
- Highest: Massachusetts 55.1, New Hampshire 45.6, Connecticut 41.9, New Jersey 39.2, Florida 36.0
- Middle: California 27.1, New York 16.9, Texas 16.6
- Lowest: Iowa 10.2, Oklahoma 9.8, Montana 8.5, Mississippi 8.1, Wyoming 7.5
What the spread means
That is a seven-fold difference in provider supply between Massachusetts and Wyoming - and more than half of US counties have no BCBA at all. Where supply is dense, providers compete for the same searching families and auction prices climb. Where supply is thin, clicks are cheaper - but a "qualified" lead may live ninety minutes from your nearest clinic, and waitlists do the filtering that marketing should have done. A Michigan caregiver survey found roughly three quarters of families who pursued ABA hit a waitlist, averaging about five and a half months.
Coverage rules set the ceiling. All fifty states have mandated autism coverage in state-regulated plans since 2019, and every state Medicaid program covers medically necessary ABA for children - but age caps, dollar caps, and Medicaid rates differ by state, which changes both what a family can pursue and what a client is worth to the practice.
Put those together and you get the honest version of the state-by-state answer: competitive, high-mandate coastal states buy expensive clicks against many rivals; low-supply states buy cheap clicks against geography itself. Neither is free. They just pay in different places - one in the ad auction, the other in intake filtering and drive time.
Free 90-second visibility check
Complete your 90-second visibility check.
Answer seven quick questions. We will flag the weak spots, inspect your public homepage, and email your human-reviewed score and three priorities.
- See where qualified search demand may be leaking
- Reviewed by a person before it reaches your inbox
- No patient or clinical information requested
Service visibility
Does every service you want to grow have a dedicated page built around what families and referral sources actually search?
Choose an answer to continue
The arithmetic that actually matters
Lead prices sound alarming until they are placed next to what a client is worth. Intensive ABA treatment is commonly cited across the industry at $40,000 to $60,000 per year per child before insurance adjustments. Run the pencil test: at the $141 published average cost per lead, if one lead in two qualifies (an illustrative assumption - measure your own), a qualified lead costs about $282. That is less than one percent of a single client's first-year value.
This is why "leads are too expensive" is almost never the real problem. At these ratios, a practice can pay well above the benchmark for a qualified lead and still grow profitably. The real losses sit elsewhere: budget spent on clicks that were never going to qualify, qualified callers lost to slow intake, and reporting that cannot tell the two apart.
What to do with these numbers
- Measure cost per qualified lead, not cost per click. If your reporting stops at clicks or raw form fills, you cannot see which channel produces families who become evaluations.
- Wire the funnel end to end. GA4 plus call tracking plus EHR offline-conversion upload is what connects a Tuesday click to an intake three weeks later.
- Fight the auction with relevance, not budget. Location pages and service pages that match what families actually search lower your effective click cost in exactly the metros where clicks are dearest.
- Price your own market. Your prevalence, your provider density, your payer mix - the benchmark that matters is yours, measured, over rolling ninety days.
Sources
LocaliQ, Healthcare Search Advertising Benchmarks (opens in a new tab) (Jan 2026) - medians across 3,542 US healthcare search campaigns, Oct 2024-Sep 2025. Primary industry dataset.
WordStream, Google Ads Benchmarks 2026 (opens in a new tab) (May 2026) - 13,474 US search campaigns, Apr 2025-Mar 2026. Primary industry dataset.
First Page Sage, Average Cost Per Lead by Industry (opens in a new tab) (updated Dec 2025) - "lead" defined as a direct email, phone, or in-person connection. Aggregated client data.
WordStream, Facebook Ads Benchmarks (opens in a new tab) (Sep 2025) - healthcare is the "Physicians & Surgeons" lead-campaign category. Primary industry dataset.
CDC, MMWR Surveillance Summaries 74(SS-2) (opens in a new tab) (Apr 2025) - ADDM Network, surveillance year 2022, children aged 8. Primary government surveillance; site-level, not statewide.
TYGES, ABA Care Deserts in the U.S. (opens in a new tab) (Jan 2026) - BCBAs per 100,000 residents from BACB certificant data (Oct 2025) and Census estimates. Secondary analysis of primary BACB data.
Lead to Recovery, ABA Therapy Google Ads (opens in a new tab) (Mar 2026) and Chit Chat Marketing (opens in a new tab) (2025) - agency-reported keyword ranges; directional only.
Disability Scoop, autism coverage required in all 50 states (opens in a new tab) (2019); CMS 2014 EPSDT guidance on Medicaid ABA coverage.
EMU / Autism Alliance of Michigan caregiver survey (opens in a new tab) (2022) - single-state survey, n=78 caregivers; waitlist figures among the 48 who pursued ABA.
Behavioral Innovations, Cost of ABA Therapy (opens in a new tab) (2026) - the $40,000-60,000 annual range is a commonly cited industry figure without a single primary source. Provider-published.
About the contributors

Written by
Michael Pavlovskyi
Managing Partner
Michael leads growth and partnerships across Breaking News ABA and Ripley Fieldwork Tracker. His background spans digital marketing, audience development, automation, and building ABA-focused products. He connects campaign strategy to distribution and the operating systems required to turn attention into measurable demand.
View contributor profile
Data analysis by
Caleb Mukasa
Data Analyst
Caleb works on the data behind Digital Marketing ABA's case studies and benchmarks - analytics exports, measurement, and the verification that keeps every published number tied to a documented source. He came to the team through UWC and Lake Forest College, where he studies data science and computer science, and brings a builder's approach to analytics tooling and reporting.
View contributor profileKnow your own number
What does a qualified lead cost your practice?
Take the 90-second assessment, or talk with our team about wiring your funnel so the answer comes from your data instead of a benchmark.